
Age-standardized global trends
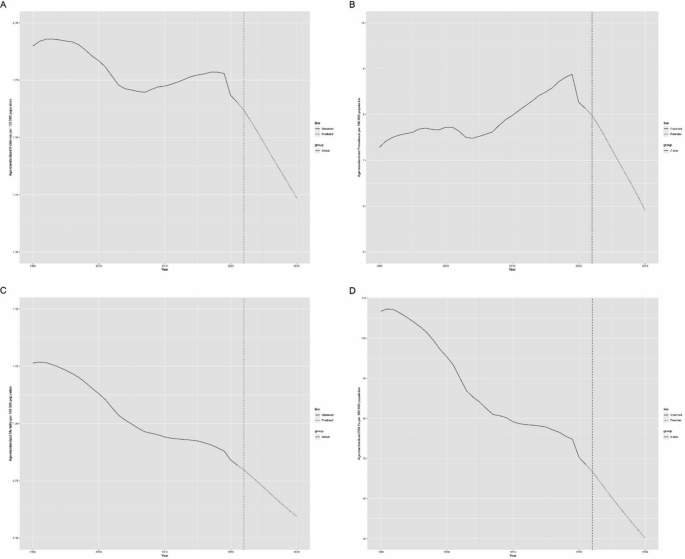
Globally, the incidence of childhood brain and CNS cancer generally declined from 1990 to 2021 (AAPC = − 0.52, 95% CI [− 0.62, − 0.42]). Joinpoint regression analysis revealed marked shifts in incidence rates during 1997, 2005, and 2019. The incidence rate experienced a slight decline from 1990 to 1997 (AAPC = − 0.02, 95% UI [− 0.22, 0.17]), a marked decline between 1998 and 2005 (AAPC = − 1.56, 95% UI [− 1.72, − 1.39]), an increase from 2006 to 2019 (AAPC = 0.43, 95% UI [0.37, 0.49]), and a significant decline after 2020 (AAPC = − 4.67, 95% UI [− 5.90, − 3.41]). Joinpoint regression also revealed marked shifts in disease incidence in 2000, 2004, and 2019. While there was a decline in prevalence between 2000 and 2004 and post-2019 (AAPC = − 1.17, 95% UI [− 1.89, − 0.44]; AAPC = − 4.96, 95% UI [− 6.61, − 3.29]), the overall trend from 1990 to 2021 was an increase (AAPC = 0.27, 95% CI [0.12, 0.42]). As shown in Fig. 2 and Tables 1, 2.

Global trends in age-standardized rates (per 100,000 people) of childhood brain and central nervous system cancers from 1990 to 2021. A Age-standardized incidence; B age-standardized incidence; C age-standardized mortality; D age-standardized DALYs
From 1990 to 2021, both the mortality and disability-adjusted life years (DALYs) for the disease consistently decreased (AAPC = − 1.44, 95% UI [− 1.57, − 1.31]; AAPC = − 1.46, 95% CI [− 1.59, − 1.33]). Joinpoint regression analysis revealed significant changes in mortality rates and DALYs from 1997 to 2018. As shown in Fig. 2 and Tables 1, 2.
Age-standardized global trends by sex
Globally, the incidence of brain and CNS cancer has been declining in both boys and girls. The incidence rates decreased from 2.03 per 100,000 (95% UI [1.28, 2.87]) and 1.76 per 100,000 (95% UI [1.21, 2.58]) to 1.67 per 100,000 (95% UI [1.13, 2.27]) in boys and from 1.63 per 100,000 (95% UI [1.35, 1.91]) in girls. The average annual percentage change (AAPC) was − 0.68 (95% CI [− 0.82, − 0.53]) for boys and − 0.32 (95% CI [− 0.42, − 0.22]) for girls. Although there was a greater incidence in boys than in girls, the gap between the sexes gradually narrowed. From 1990 to 2021, there was an increasing trend in the prevalence of this disease in both boys and girls. The prevalence increased from 7.58 per 100,000 (95% UI [5.09, 10.38]) in boys and 6.96 per 100,000 (95% UI [5.02, 9.67]) in girls in 1990 to 8.17 per 100,000 (95% UI [5.56, 11.00]) in boys and 8.09 per 100,000 (95% UI [6.61, 9.55]) in girls by 2021. The AAPC for prevalence was 0.19 (95% CI [0.02, 0.35]) for boys and 0.38 (95% CI [0.25, 0.52]) for girls. As shown in Fig. S1 and Tables 1, 2.
Mortality rates and DALYs followed similar trends in both boys and girls, with a consistent decline. The AAPC for mortality was − 1.66 (95% CI [− 1.82, − 1.49]) for boys and − 1.22 (95% CI [− 1.33, − 1.13]) for girls. The AAPC regarding DALYs was − 1.68 (95% CI [− 1.84, − 1.51]) for boys and − 1.24 (95% CI [− 1.36, − 1.13]) for girls. As shown in Tables 1, 2.
Global trends by age group
Globally, the incidence of brain and CNS cancer in children between the ages of 10 and 14 years increased from 1.36 per 100,000 (95% UI [1.10, 1.59]) in 1990 to 1.49 per 100,000 (95% UI [1.27, 1.80]) in 2021. The AAPC for this group was 0.29 (95% CI [0.14, 0.45]). In the other two age categories, the incidence exhibited a declining trend, with the most notable decrease observed in children under 5 years old, dropping from 2.47 per 100,000 (95% UI [1.81, 3.25]) in 1990 to 1.77 per 100,000 (95% UI [1.36, 2.25]) in 2021. The AAPC value was − 1.2 (95% CI [− 1.32, − 1.07]). In the 5–9 year age group, the AAPC was − 0.26 (95% CI [− 0.45, − 0.06]). As shown in Fig. S2 and Tables 1, 2.
The mortality and DALY trends were uniform across all three age categories, showing a declining trend. The most significant reduction in mortality occurred in children under 5 years of age, decreasing from 1.62 per 100,000 (95% UI [1.14, 2.18]) in 1990 to 0.86 per 100,000 (95% UI [0.64, 1.13]) in 2021, with an AAPC of − 2.12 (95% CI [− 2.26, − 1.98]). The AAPC values for the 5–9- and 10–14-year-old age categories were − 1.23 (95% CI [− 1.38, − 1.08]) and − 0.65 (95% CI [− 0.77, − 0.53]), respectively. Similarly, the most marked reduction in DALYs was found in children under 5 years of age. DALYs decreased from 143.38 (95% UI [101.31, 193.18]) in 1990 to 76.36 (95% UI [57.26, 99.81]) in 2021, with an AAPC of − 2.11 (95% CI [− 2.25, − 1.97]). The AAPC values for the 5–9- and 10–14-year-old age categories were − 1.22 (95% CI [− 1.38, − 1.07]) and − 0.64 (95% CI [− 0.76, − 0.52]), respectively. As shown in Fig. S2 and Tables 1, 2.
Age-standardized global trends by SDI region
We divided the globe into five regions on the basis of the sociodemographic index (SDI) and compared childhood brain and CNS cancer incidence, mortality, and DALYs across these regions.
The incidence of childhood brain and CNS cancer was greater in the high- and upper-middle-SDI regions, whereas the low-SDI region had the lowest incidence. Overall, incidence rates declined in all regions, excluding the low- and lower-middle-SDI regions. The most notable decrease occurred in the middle-SDI region, where the incidence rate decreased from 2.22 per 100,000 (95% UI [1.56, 2.76]) in 1990 to 1.99 per 100,000 (95% UI [1.51, 2.53]) in 2021, with an AAPC of − 0.46 (95% CI [− 0.68, − 0.25]). In the upper-middle-SDI region, the AAPC was − 0.43 (95% CI [− 0.70, − 0.16]), whereas in the high-SDI region, it experienced only a mild reduction, with an AAPC of − 0.09 (95% CI [− 0.29, 0.10]). Notably, the incidence in the high-SDI region surpassed that in the upper-middle-SDI region for the first time in 2012. In terms of prevalence, the high-SDI region consistently had the highest rates. The prevalence increased across all regions, with the most notable increase in the upper-middle-SDI region, where it increased from 11.62 per 100,000 (95% UI [9.09, 14.11]) in 1990 to 16.34 per 100,000 (95% UI [12.74, 21.40]) in 2021, with an AAPC of 0.97 (95% CI [0.62, 1.32]). As shown in Fig. S3 and Tables 3, 4.
Both mortality rates and DALYs significantly declined, particularly in the upper-middle-SDI region. Mortality rates decreased from 1.96 per 100,000 (95% UI [1.52, 2.38]) in 1990 to 0.96 per 100,000 (95% UI [0.79, 1.22]) in 2021, with an AAPC of − 2.36 (95% CI [− 2.60, − 2.11]). DALYs decreased from 165.74 (95% UI [128.14, 201.99]) to 81.25 (95% UI [66.16, 103.25]), with an AAPC of − 2.37 (95% CI [− 2.62, − 2.13]). As shown in Fig. S3 and Tables 3, 4.
Regional age-standardized burden of childhood brain and CNS cancer
In 2021, East Asia had the greatest age-standardized incidence rate (ASIR) of childhood brain and CNS cancer, followed by the high-income Asia Pacific region. The greatest age-standardized prevalence rate (ASPR) was noted in high-income Asia Pacific, with high-income North America ranking second. Central Asia had the highest age-standardized rates of mortality (ASMRs) and DALYs, followed by Andean Latin America. Since 1990, the ASIR has increased in more than half of the regions, with the most notable increase occurring in southern sub-Saharan Africa. Prevalence rates have also increased in most regions, especially in North Africa and the Middle East. Mortality rates and DALYs have decreased in most regions, with the most significant reduction occurring in East Asia. Additionally, the ASIR, ASPR, and age-standardized rate of mortality.
ASMR and DALYs are generally higher for boys than for girls in most regions, which is consistent with global trends. As shown in Fig. 3.

Regional age-standardized rates (per 100,000 population) of childhood brain and central nervous system cancers in 2021 and their percentage changes in rates for different sexes from 1990 to 2021. A Age-standardized incidence in 2021; B percentage change in age-standardized incidence, 1990–2021; C age-standardized prevalence in 2021; D percentage change in age-standardized prevalence, 1990–2021; E age-standardized mortality in 2021; F percentage change in age-standardized mortality, 1990–2021; G age-standardized DALYs in 2021; H percentage change in age-standardized DALYs, 1990–2021
The burden of childhood brain and CNS cancer varies significantly by SDI. Higher-SDI regions tend to have higher ASIRs and ASPRs. While the ASIR and ASPR generally increase with increasing SDI, regional patterns show considerable variation. Some regions exhibit declining ASIR and ASPR with increasing SDI, whereas other indices show increasing rates or no clear trend. Conversely, age-standardized death rates and DALYs consistently decrease with increasing SDI, with higher SDI areas experiencing lower ASMRs and DALYs. As shown in Fig. 4.

Trends for age-standardized rates (per 100,000 population) of childhood brain and central nervous system cancer among 21 regions by SDI from 1990 to 2021. A Age-standardized incidence; B age-standardized incidence; C age-standardized mortality; D age-standardized DALYs
National age-standardized trends
In 2021, Monaco had the greatest ASIR of childhood brain and CNS cancer globally, with an incidence of 8.18 per 100,000 (95% UI [4.45, 13.41]). Conversely, Gambia had the lowest incidence at 0.15 per 100,000 (95% UI [0.07, 0.25]). Monaco also recorded the greatest ASPR at 58.25 per 100,000 (95% UI [31.61, 196.25]), whereas Gambia had the lowest prevalence rate of 0.49 per 100,000 (95% UI [0.22, 0.82]). As shown in Fig. 5.

Countries’ age-standardized rates (per 100,000 population) of childhood brain and central nervous system cancers in 2021. A Age-standardized incidence; B age-standardized incidence; C age-standardized mortality; D age-standardized DALYs
For mortality rates and DALYs in 2021, Tajikistan reported the highest rates globally, with 2.93 per 100,000 (95% UI [1.46, 4.57]) for mortality and 249.10 (95% UI [123.31, 387.88]) for DALYs. In contrast, the Cook Islands had the lowest rates, with 0.11 per 100,000 (95% UI [0.06, 0.18]) for mortality and 8.98 (95% UI [4.79, 15.32]) for DALYs. As shown in Fig. 5.
Between 1990 and 2021, Greenland experienced the greatest decline in ASIR, with an AAPC of − 2.04 (95% CI [− 2.38, − 1.70]). Luxembourg observed the greatest decrease in ASPR, with an AAPC of − 2.41 (95% CI [− 4.74, − 0.02]). Luxembourg also had the largest reduction in the ASMR, with an AAPC of − 3.22 (95% CI [− 3.95, − 2.48]). Serbia experienced the greatest notable decline in DALYs, with an AAPC of − 3.17 (95% CI [− 3.69, − 2.64]). As shown in Fig. 6.

Trends for age-standardized rates (per 100,000 population) of childhood brain and central nervous system cancers in 204 countries from 1990 to 2021. A Age-standardized incidence; B age-standardized incidence; C age-standardized mortality; D age-standardized DALYs
The burden of childhood brain and CNS cancer varies significantly on the basis of the SDI. ASIR and ASPR increase with increasing SDI values, clearly increasing. However, the ASMRs and DALYs are highest in regions with SDI values between 0.625 and 0.75. As shown in Fig. 7.

Trends for age-standardized rates (per 100,000 population) of childhood brain and central nervous system cancers among 204 countries with SDIs from 1990 to 2021. A Age-standardized incidence; B age-standardized incidence; C age-standardized mortality; D age-standardized DALYs
Forecasting trends in childhood brain and CNS cancers
Figure 8 presents our forecast for future trends in childhood brain and CNS cancer. Our projections indicate a continued decline in all key metrics: incidence, prevalence, mortality, and DALYs. Specifically, the ASIR is expected to decrease from 1.65 per 100,000 in 2021 to 1.24 per 100,000 by 2030. ASPR is projected to decrease from 8.13 per 100,000 in 2021 to 5.91 per 100,000 in 2030. Similarly, the mortality rate is anticipated to decrease from 0.82 per 100,000 in 2021 to 0.59 per 100,000 in 2030. DALYs are forecasted to decrease from 68.54 in 2021 to 50.15 in 2030.
Prediction of change in the burden of childhood brain and central nervous system cancer to 2030. A Age-standardized incidence; B age-standardized incidence; C age-standardized mortality; D age-standardized DALYs
link