This advanced measurement, part of dual-polarization radar technology, detects how similarly shaped objects are within a storm.
MOLINE, Ill. — Doppler radar technology has been around since the late 1800s, with its first widespread use during World War II to help detect enemy aircraft.
Since the late 1940s, this same technology has been used to track dangerous thunderstorms, including tornadoes. In just the last two decades alone, the technology continues to evolve with the addition of dual-polar and super-resolution radar products and features.
Today’s question revolves around a product that doesn’t get shown on air very often, but you have likely seen it a time or two, even on social media! That product is the correlation coefficient. Billy from Clinton, Iowa, asks how this Doppler radar product helps us detect tornadoes. Let’s dig in!
Inside the radome and dual-pol technology
On March 24, 2012, the Doppler radar here in the Quad Cities at the Davenport Airport officially started outputting dual-polarization radar data. What is dual polarization?
Dual polarization radar, often called “dual-pol” radar, is a type of weather radar that sends out and receives radio waves in both horizontal and vertical directions, instead of just one direction like older radars.
This means the radar can measure not only how wide something is (horizontal), but also how tall it is (vertical). By comparing these two measurements, meteorologists can get a much better idea of the size, shape and type of objects in the atmosphere, like telling the difference between raindrops, hail, snowflakes or even debris from a tornado.
Before this technology was widely available, meteorologists had to rely on lower resolution and less reliable products from the existing radar technology to try and decode what a certain storm was doing.
What correlation coefficient tells us about tornadoes
As part of that dual-pol upgrade, a new product emerged called the correlation coefficient. It sounds fancy, and that’s because it is.
The correlation coefficient is a measure of how similar the horizontal and vertical pulses behave after being sent out from the radar. If the pulse-to-pulse change is similar between horizontal and vertical scanning, then the CC values will be high. If the pulse-to-pulse change is highly variable, then the CC will be low. In short, CC shows how similar the targets are that the radar is actively scanning.

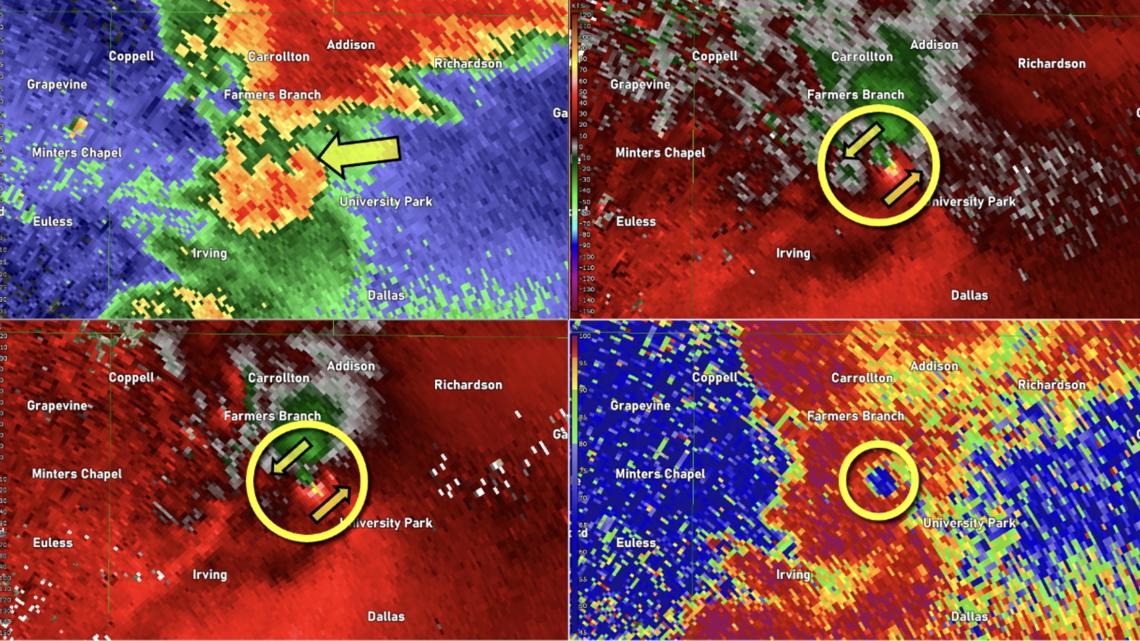
Take the above picture as an example. Here we have a severe thunderstorm with significant rotation. Here’s what each image is showing us.
- Upper Left – Reflectivity: This image displays the intensity of rainfall, something all of us are used to seeing on a radar map any given day.
- Upper Right – Velocity: This image depicts the speed and direction in which raindrops, hail, etc, are moving within a storm. The circled area represents an area of rotation, where a tornado could potentially be forming or already be on the ground.
- Lower Left – Storm-relative Velocity: Like velocity, this image shows us the speed and direction of raindrops and other objects, only concerning the storm movement, not the radar itself.
- Lower Right – Correlation Coefficient: This image gives us a view of what the radar depicts as a tornado debris signature. Notice the circled area has lower values of CC (in blue), indicating that this area contains objects that are not like others around it. In this case, debris.
Not all tornadoes will produce low values of CC. It depends on the environment, the strength of the tornado, and of course, the distance from the radar as well.
Still, the correlation coefficient is another useful tool in our toolbox when it comes to keeping you and your family safe during times of severe weather.
Have a question that you would like me to answer for an upcoming Ask Andrew segment? Submit it here!
link